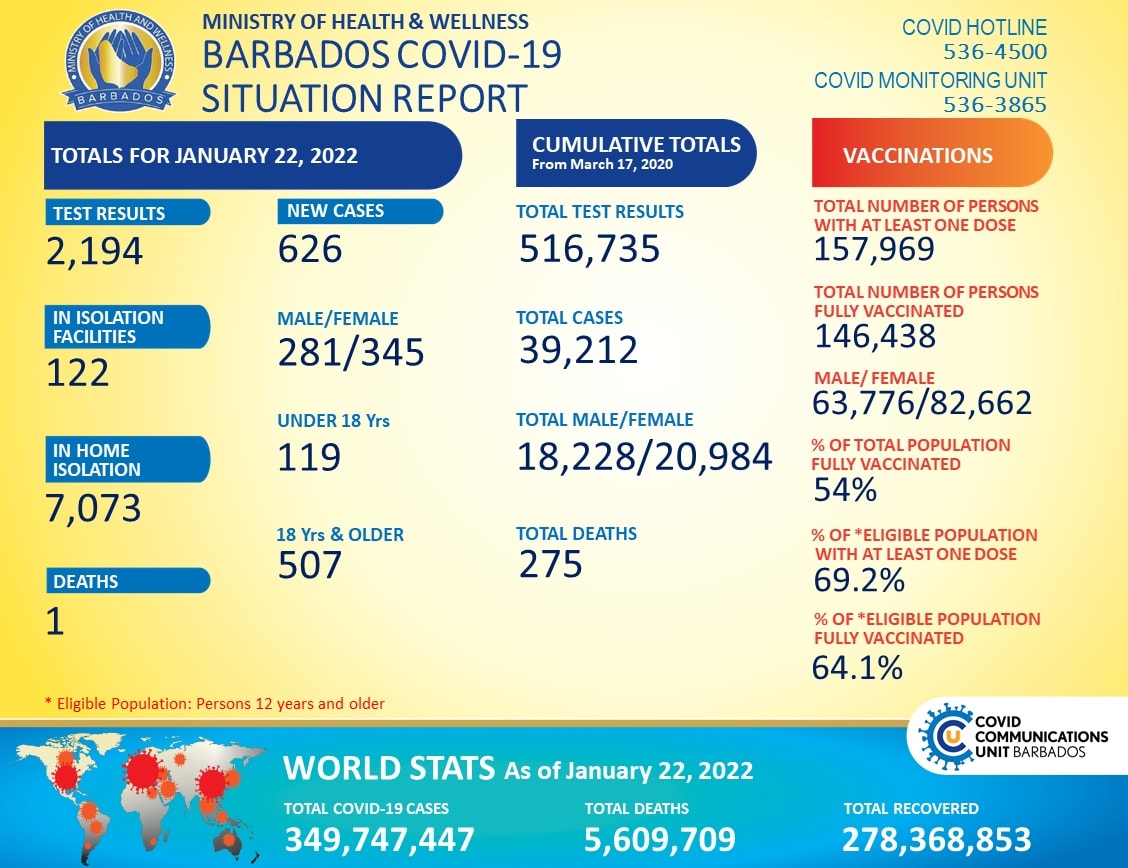
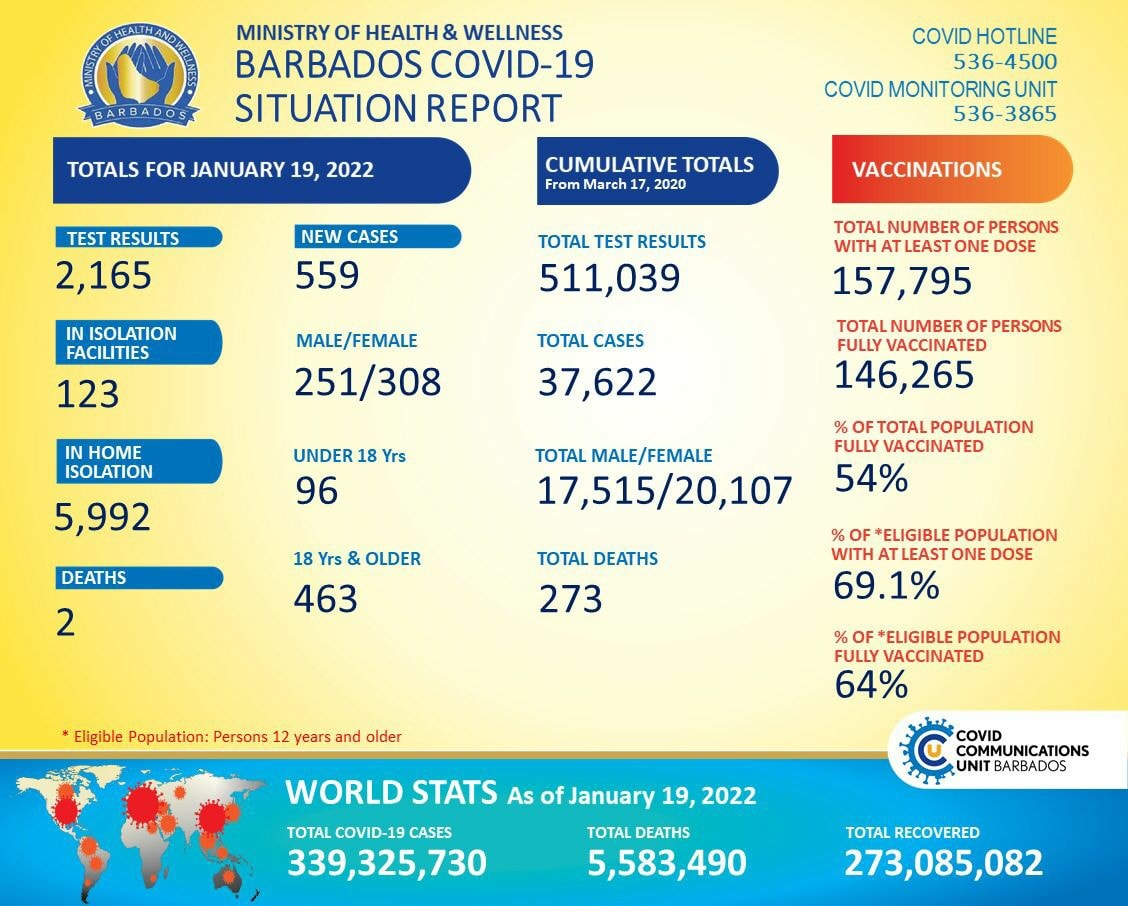
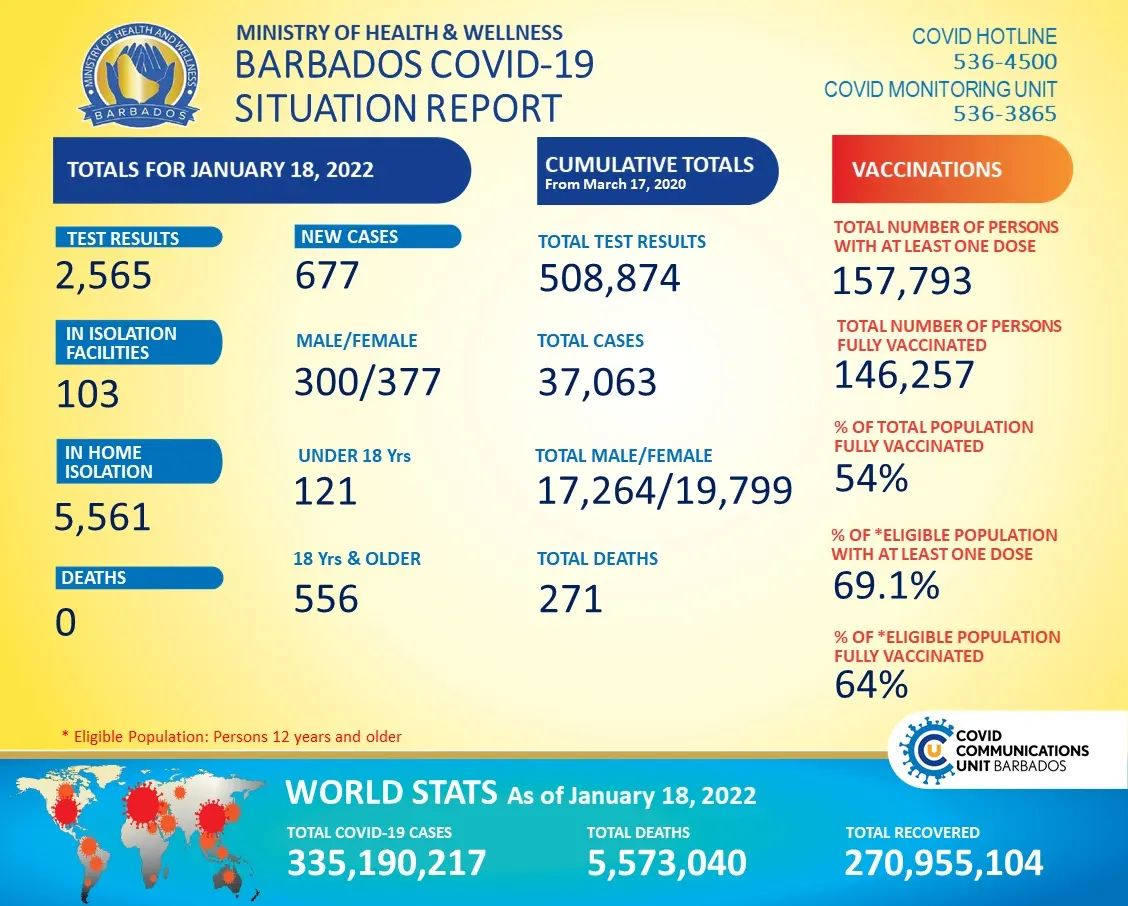
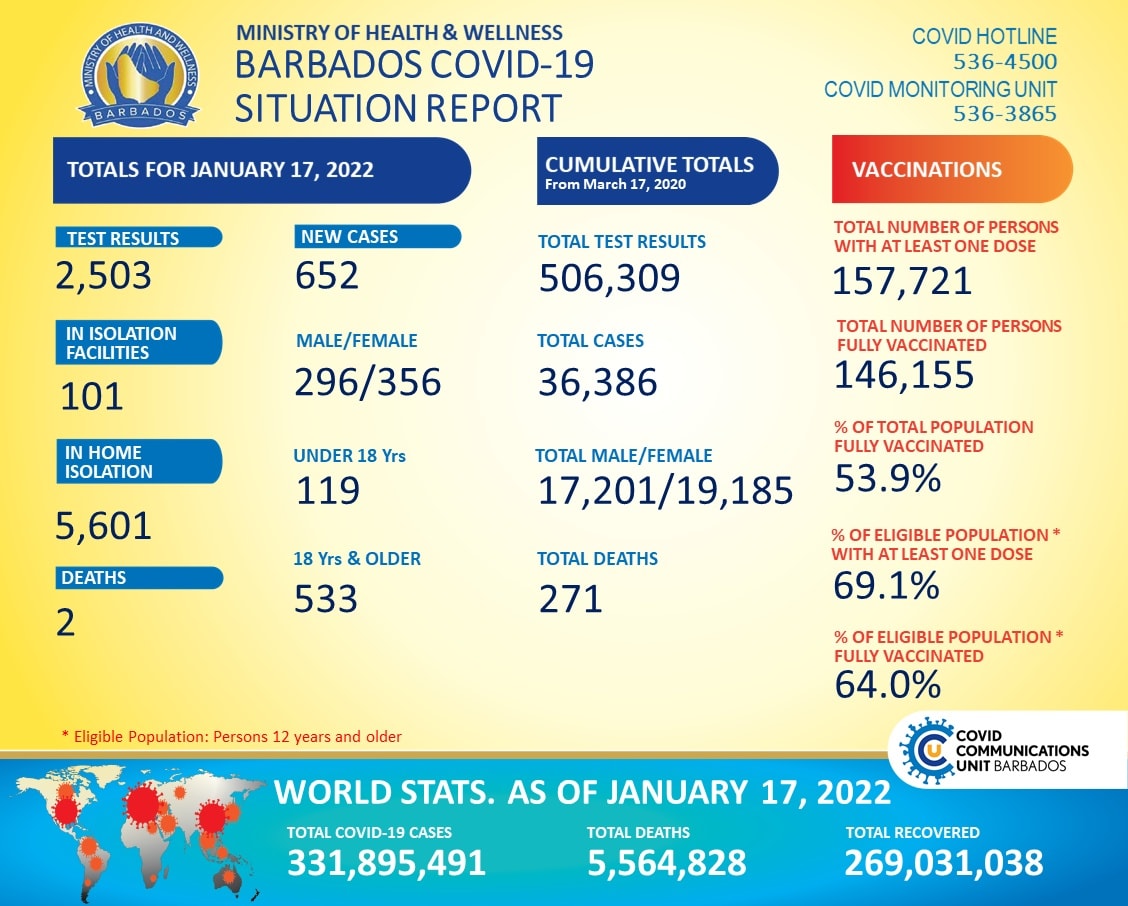
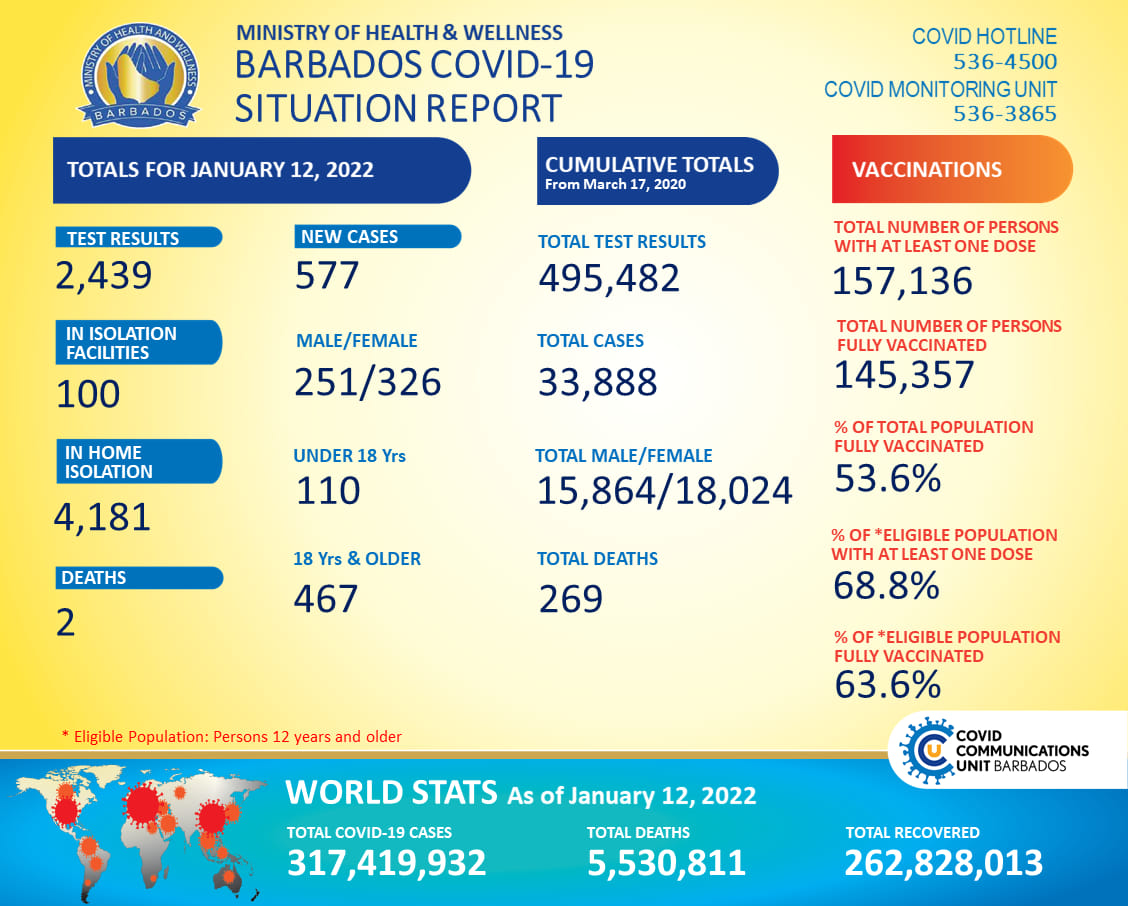
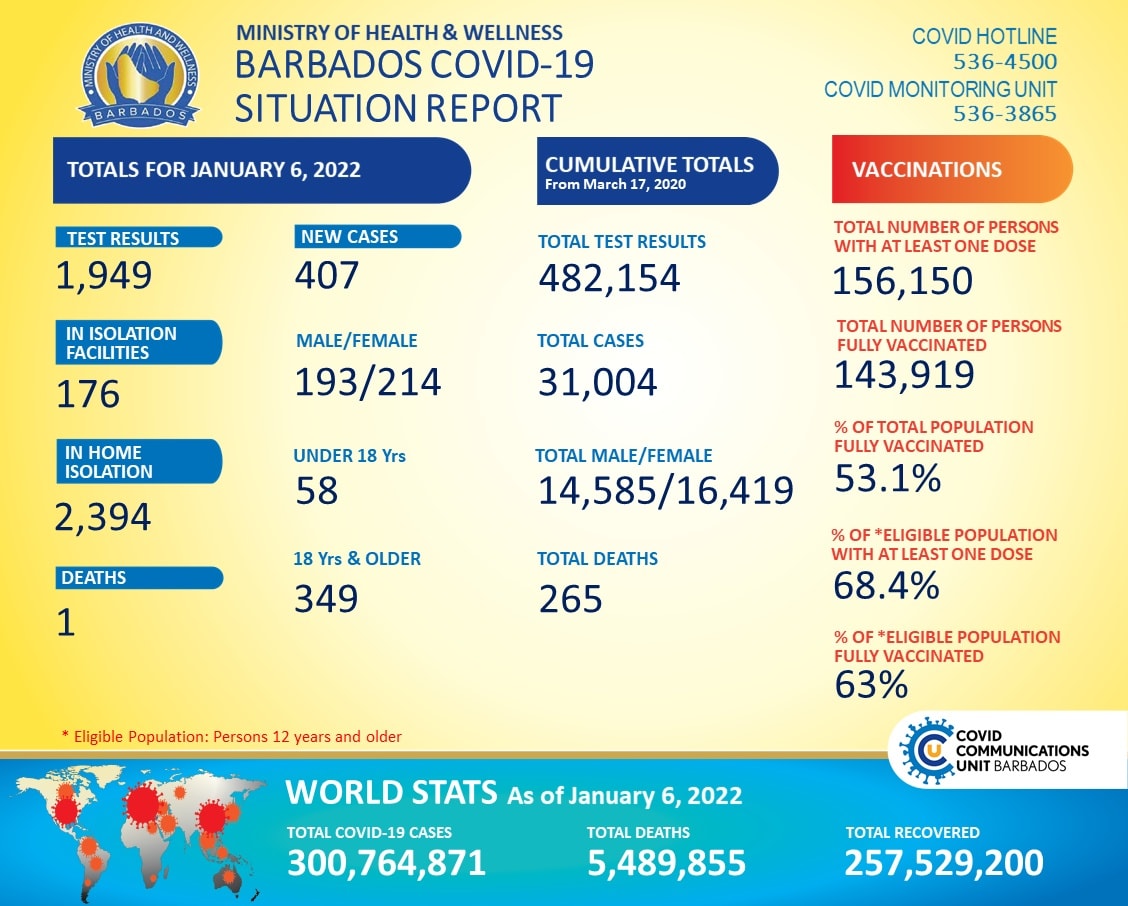
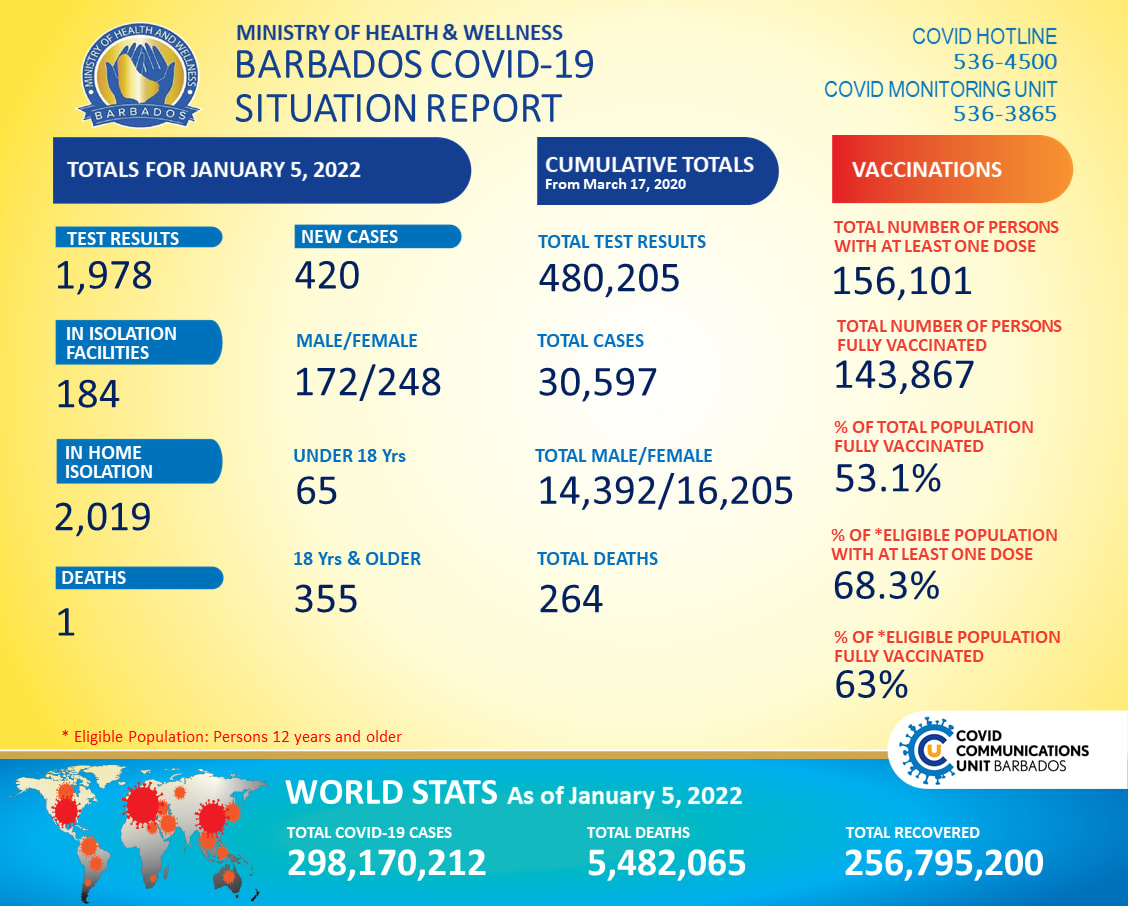
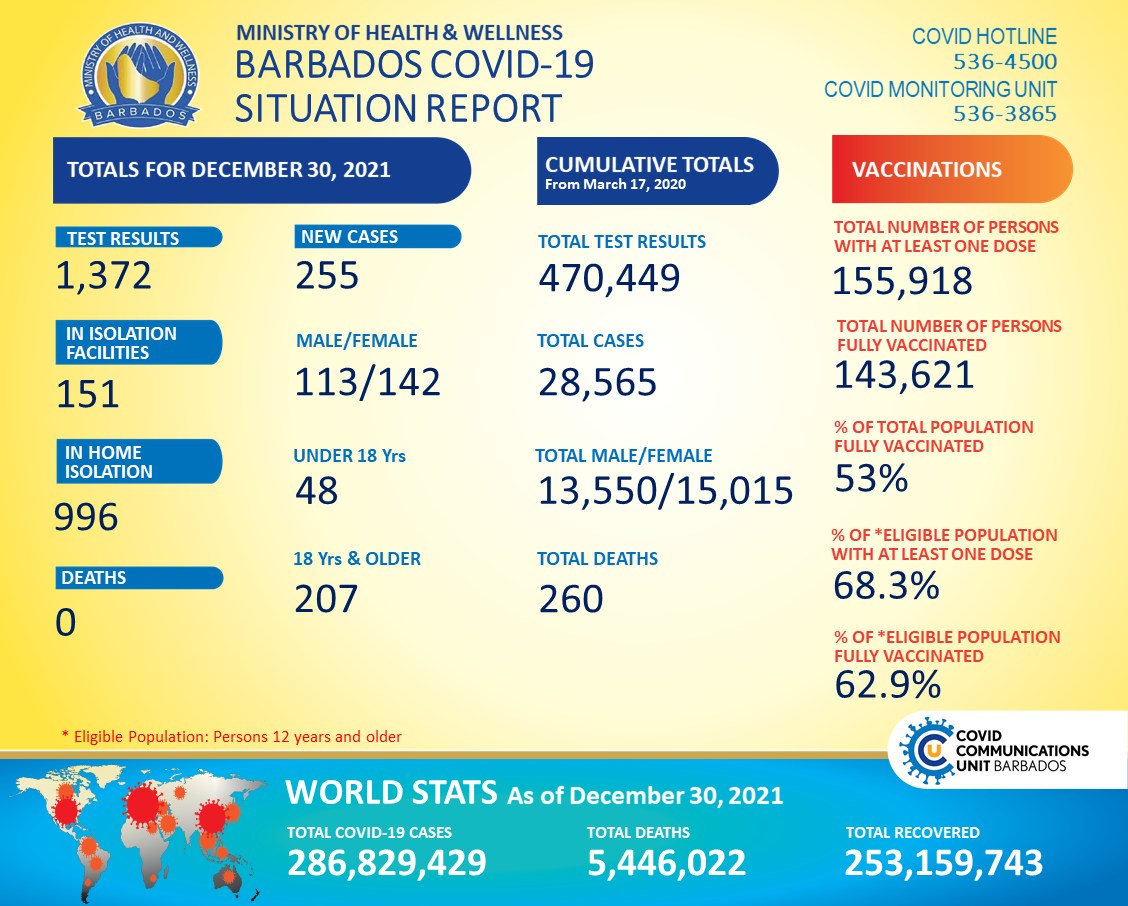
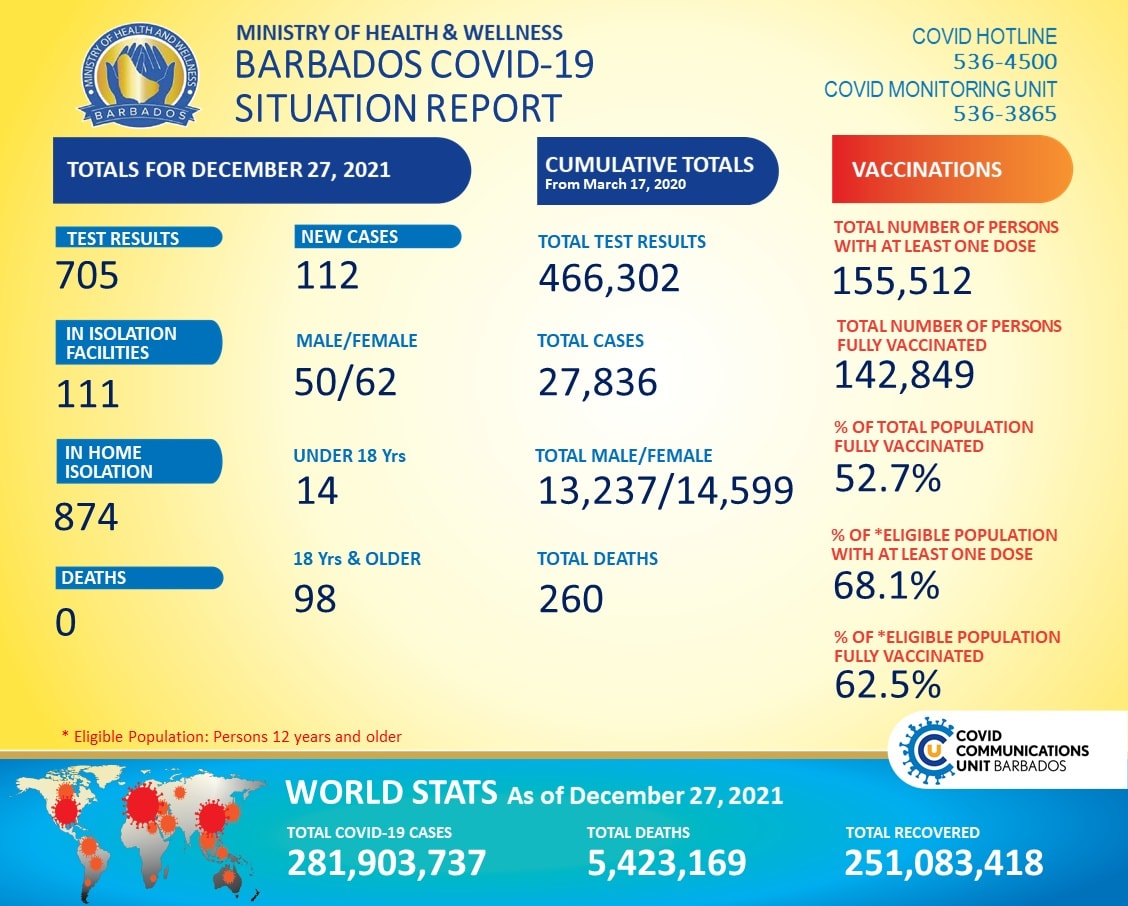
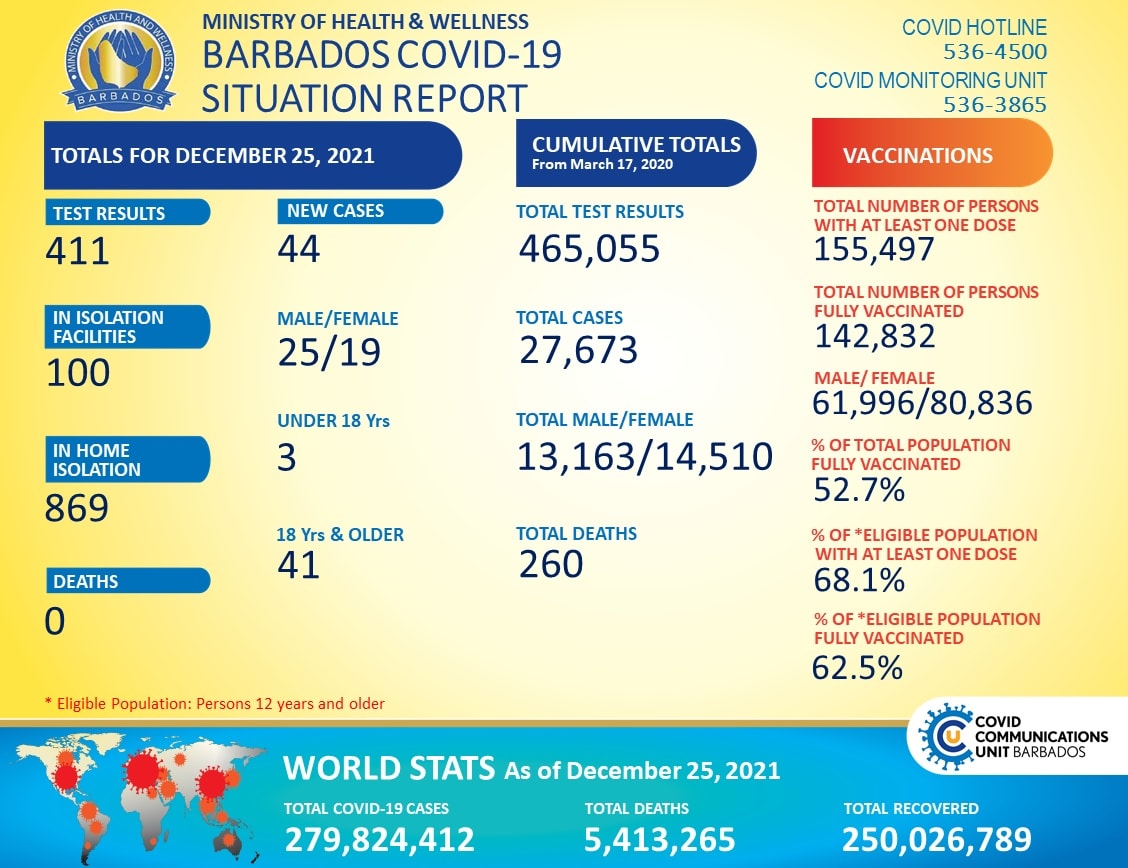
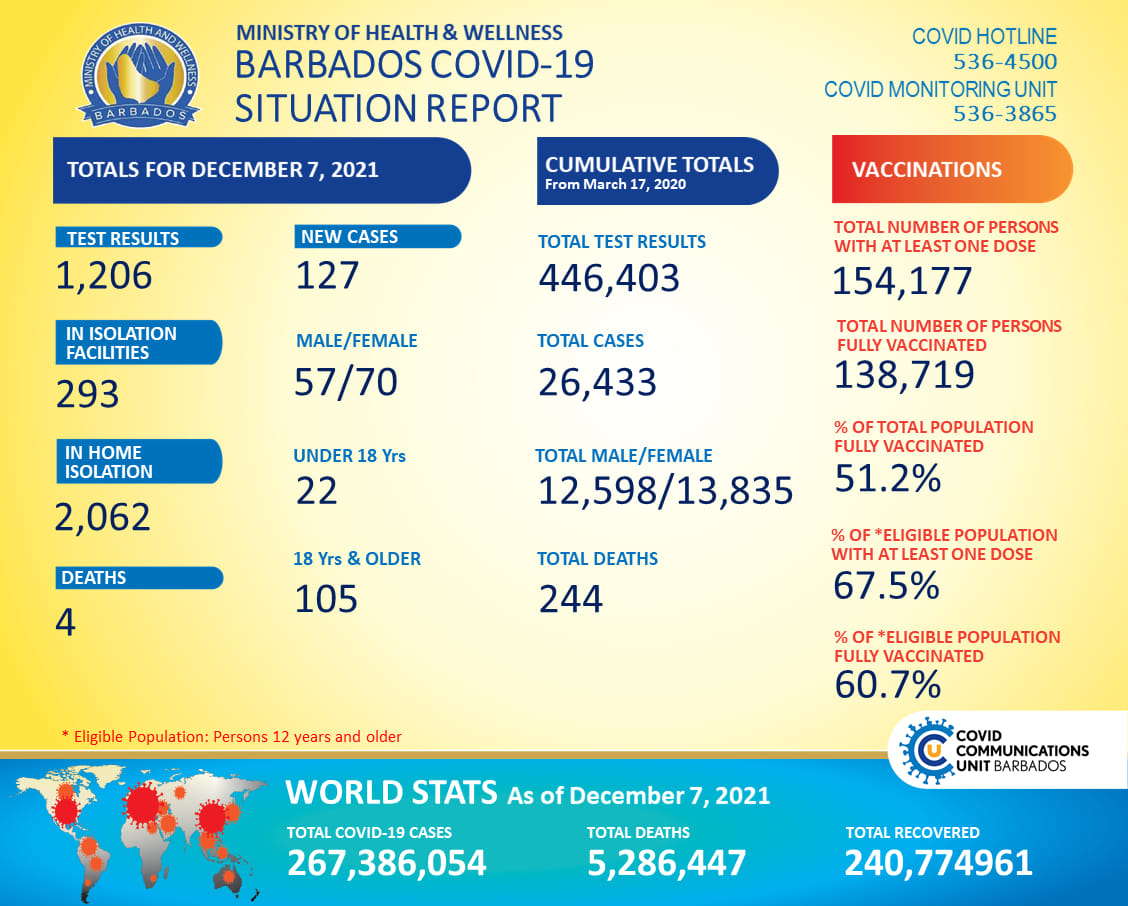
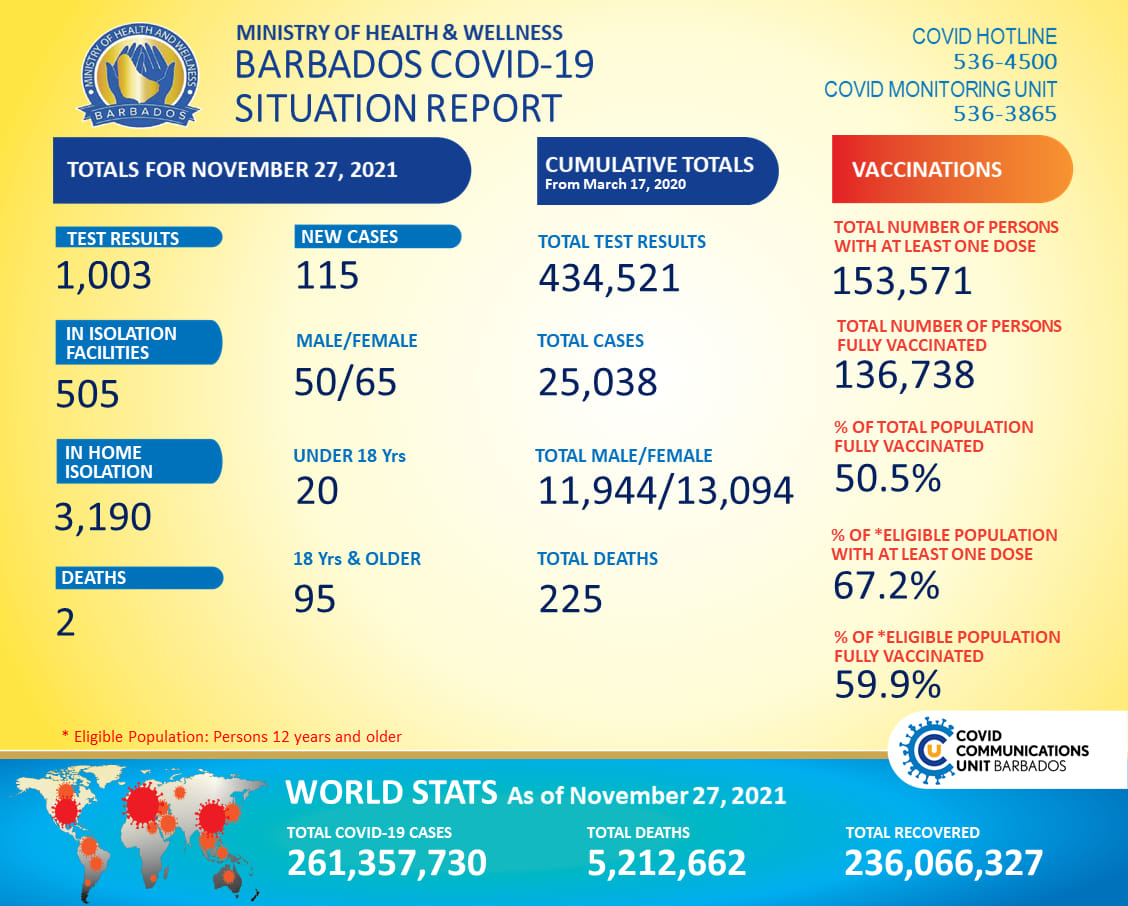
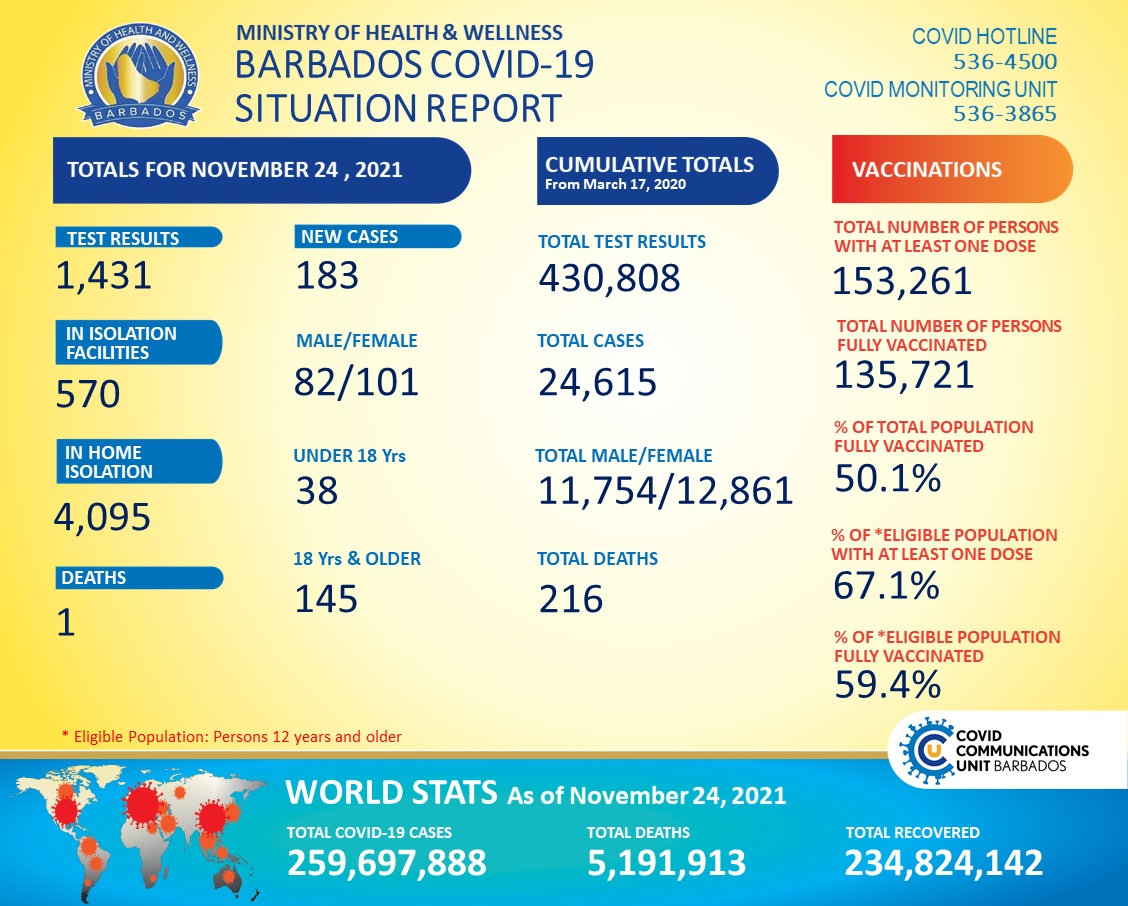
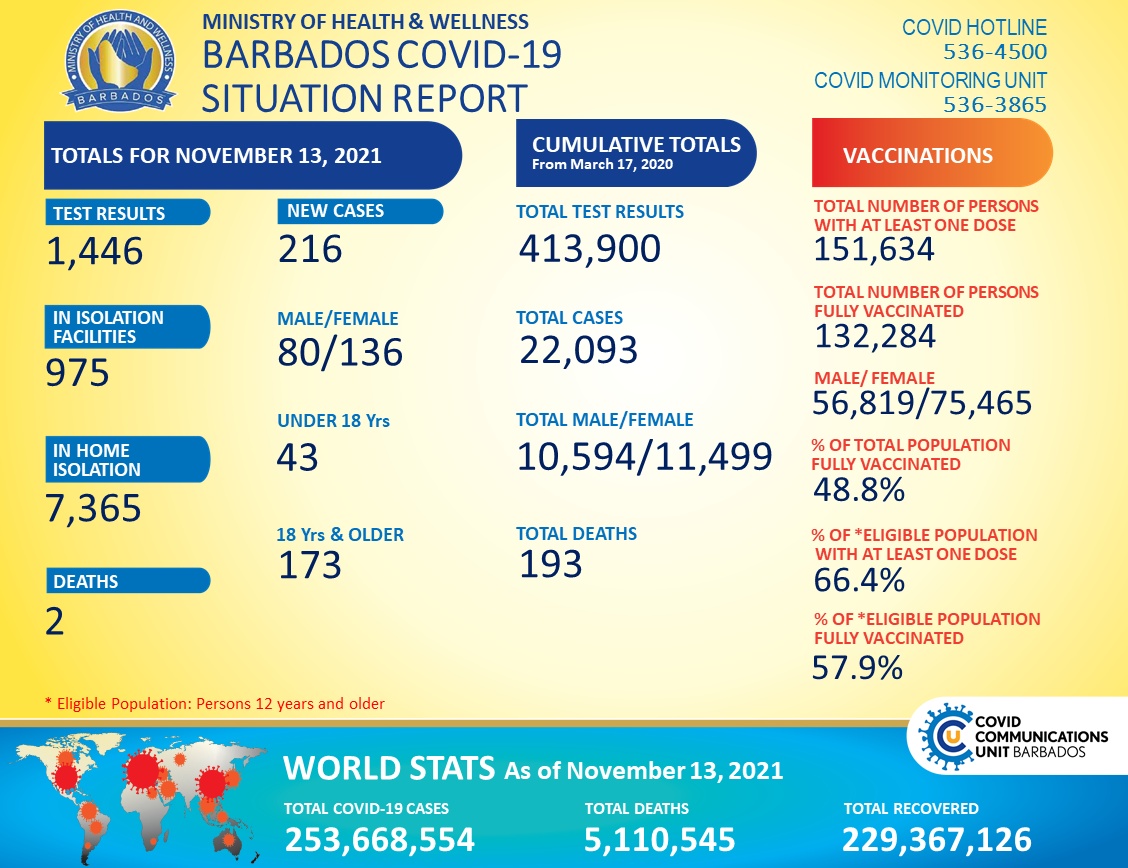
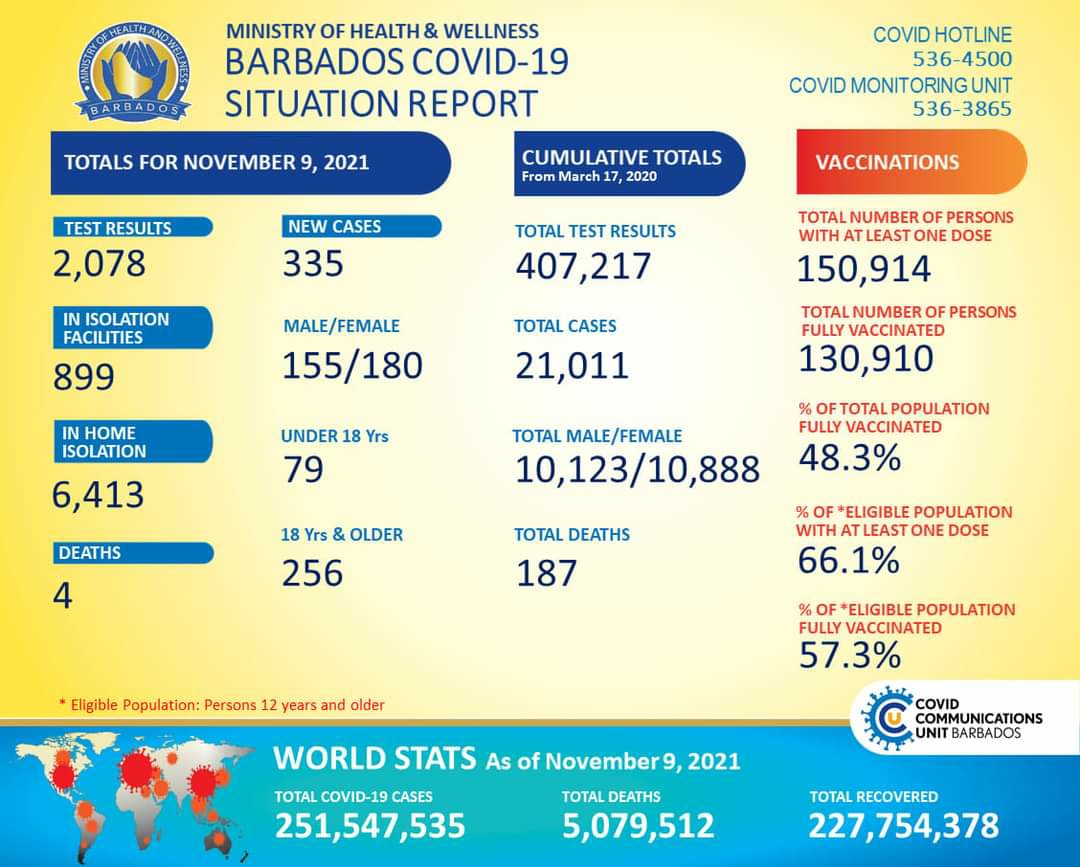
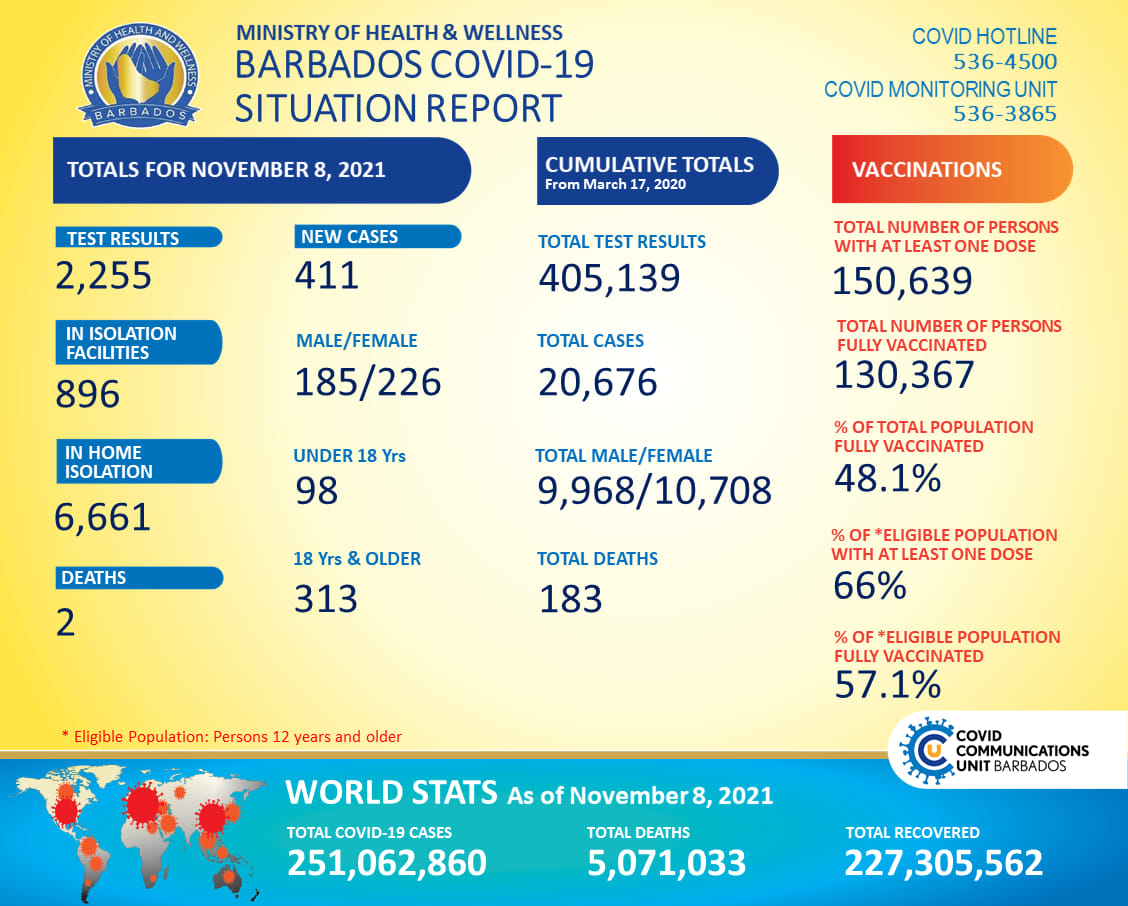
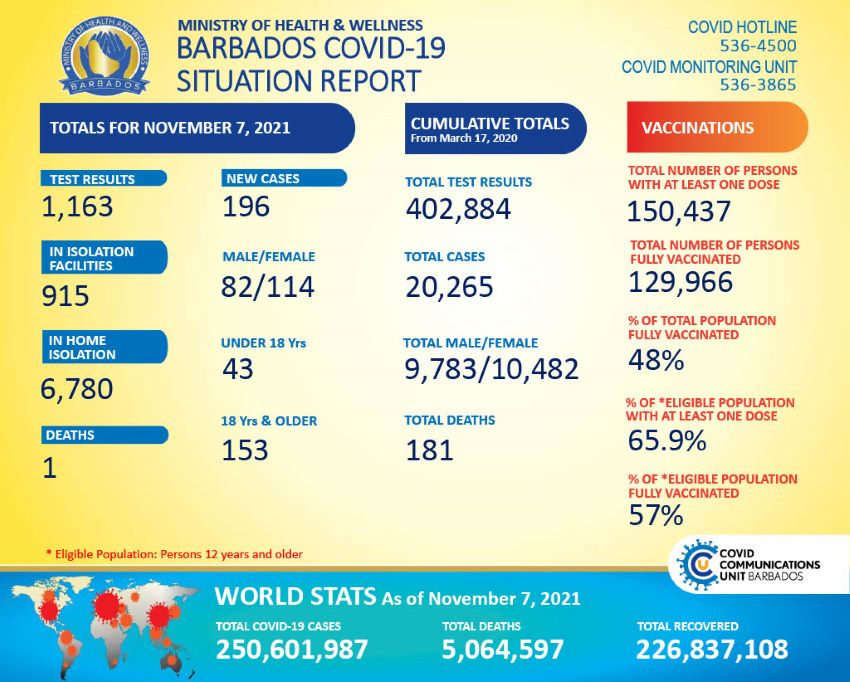
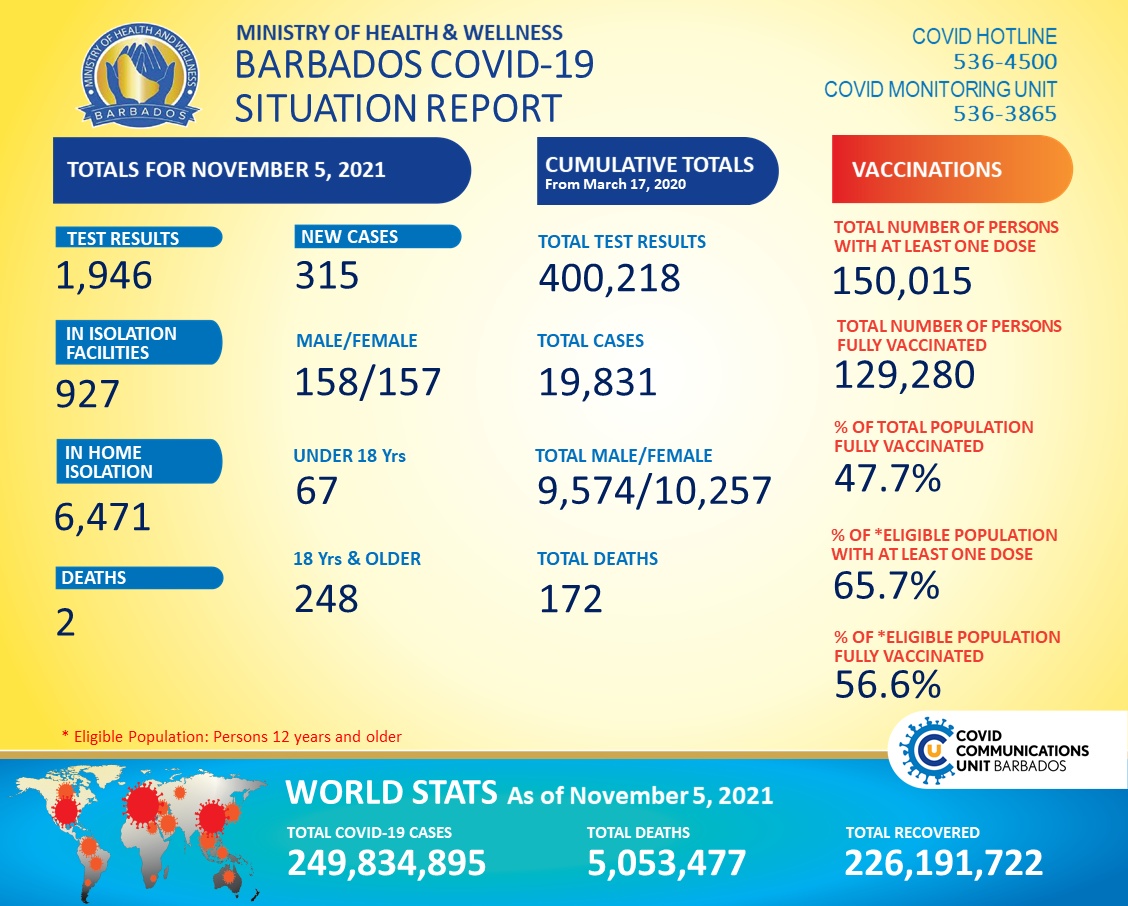
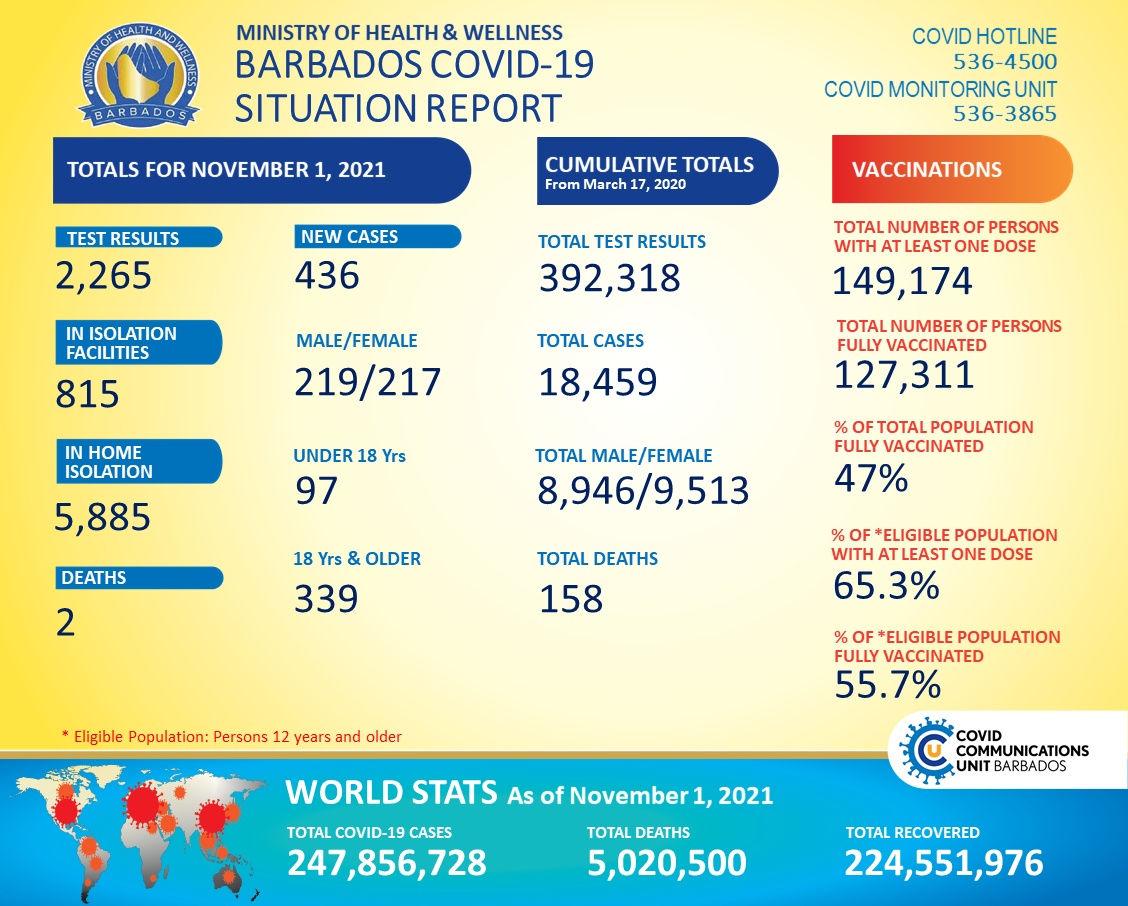
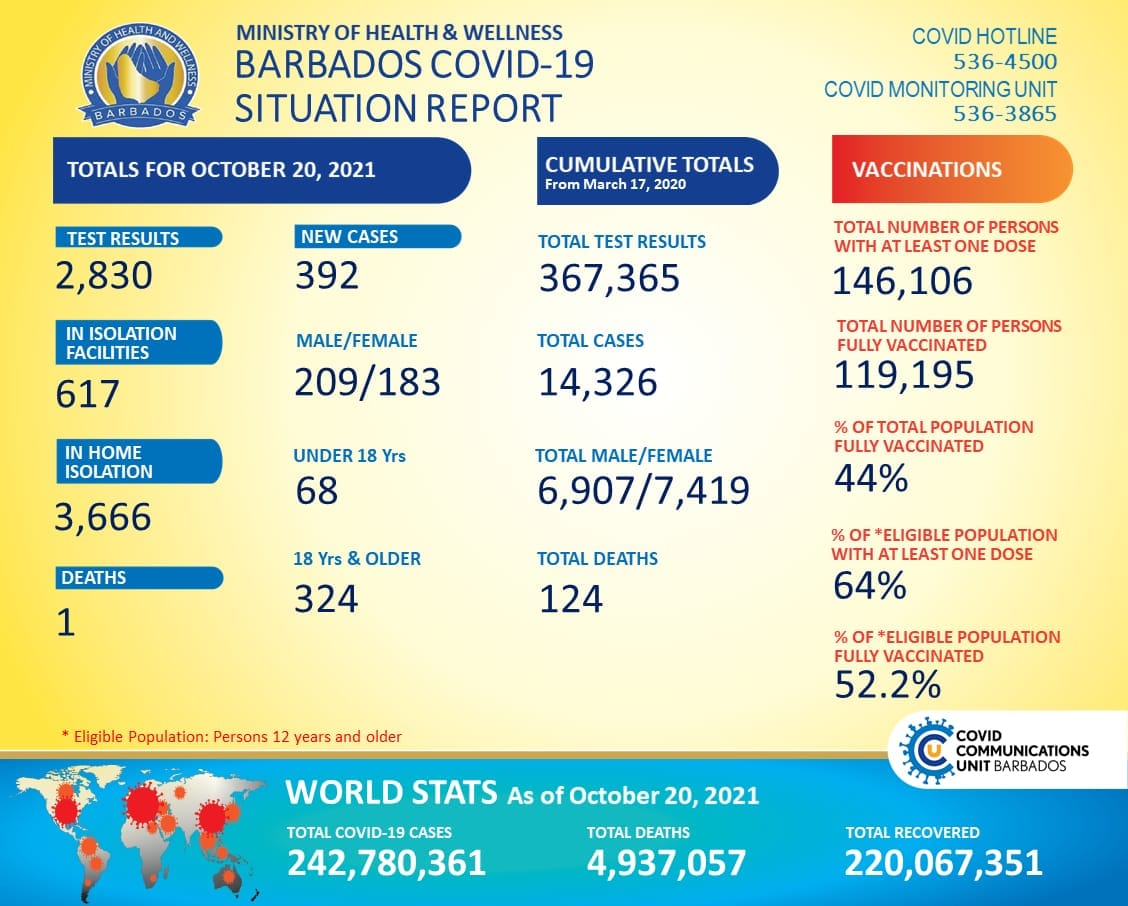
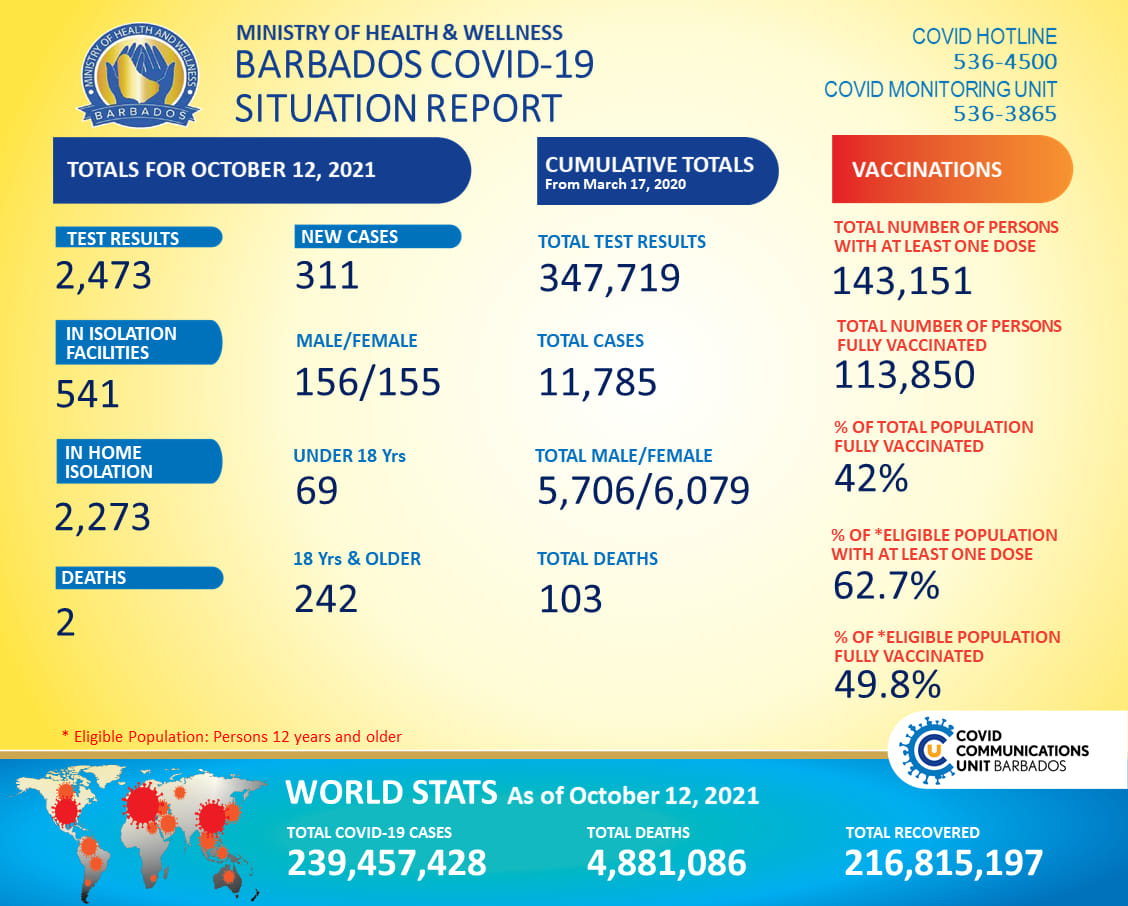
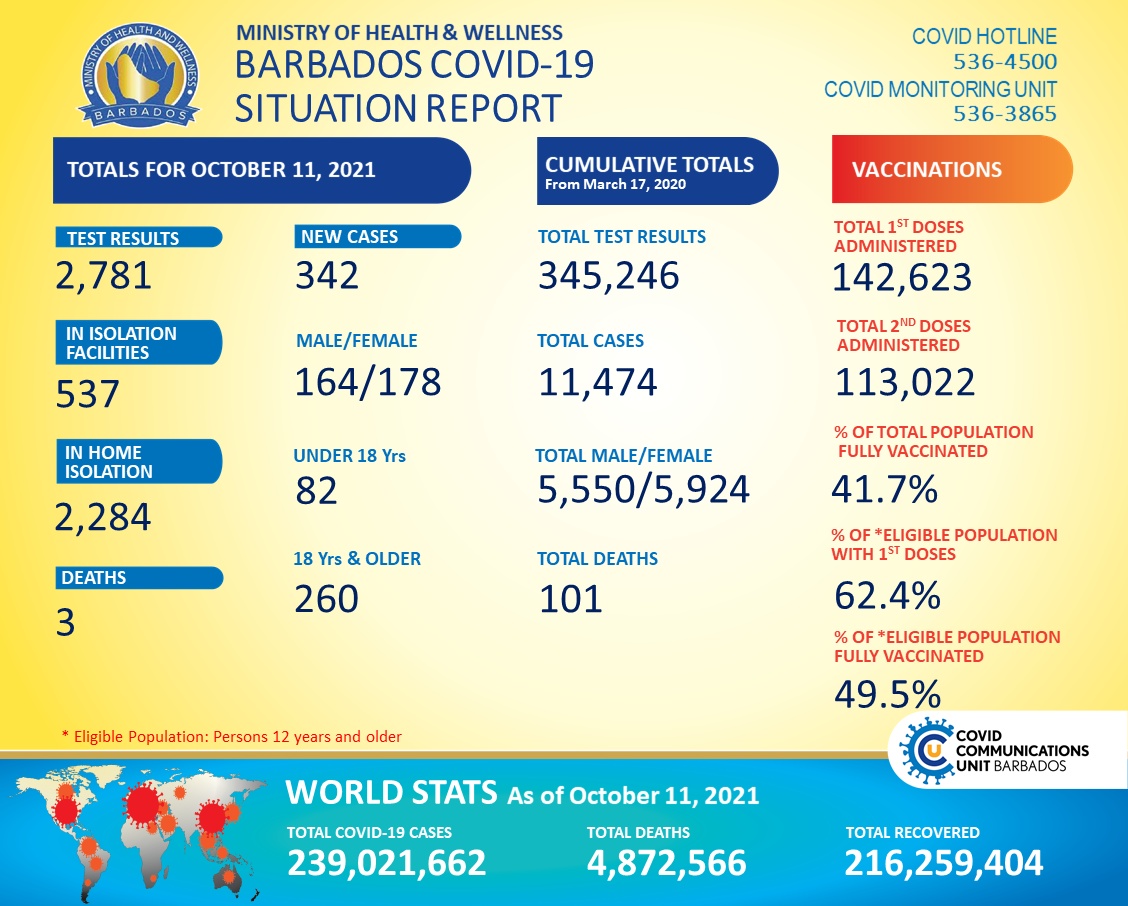
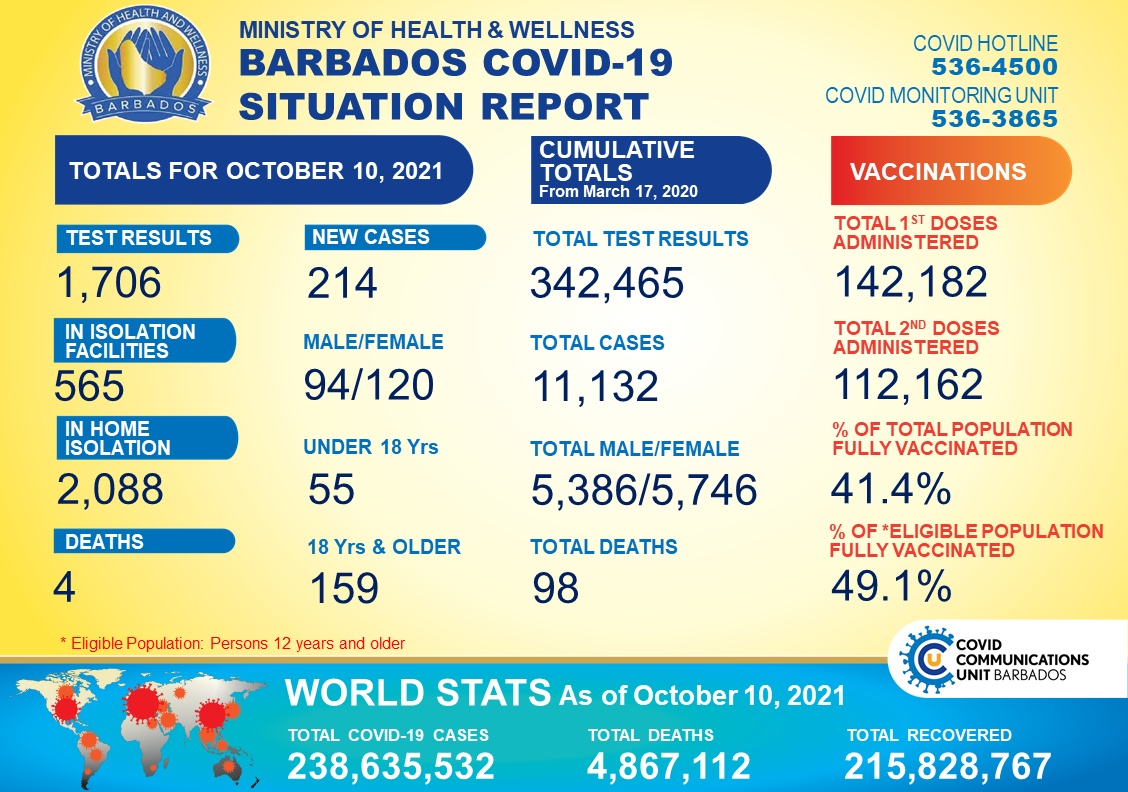
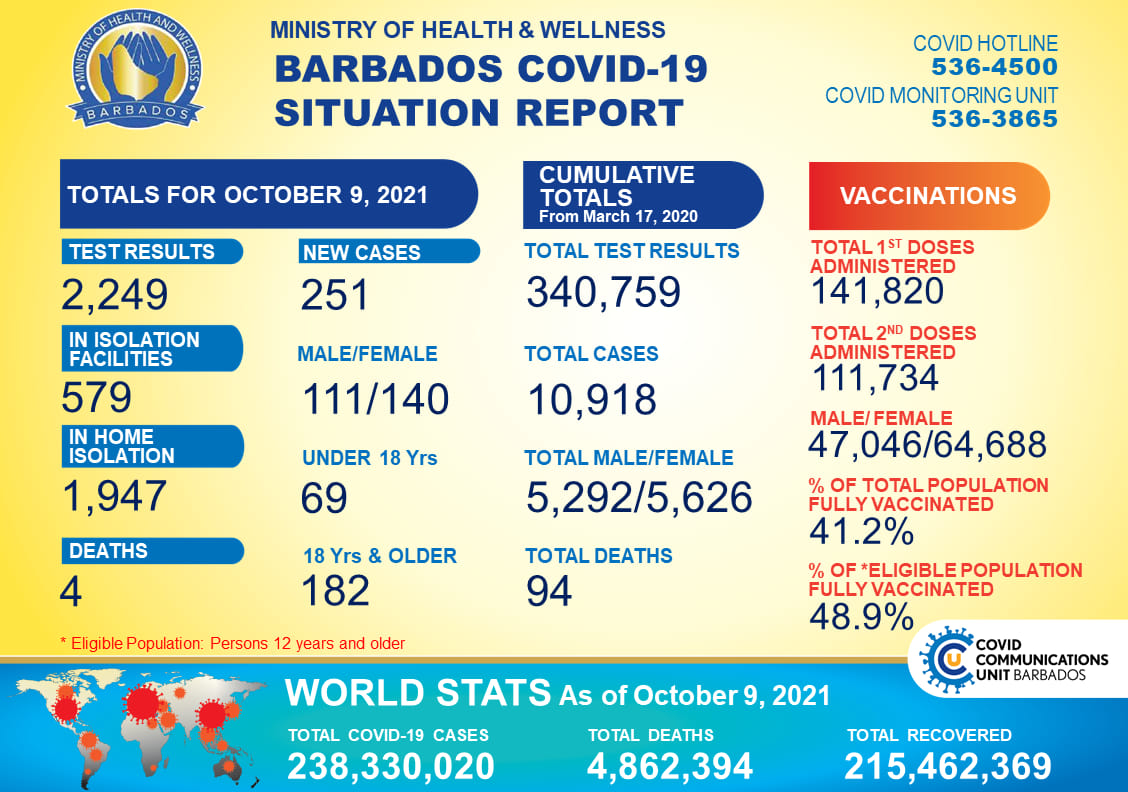
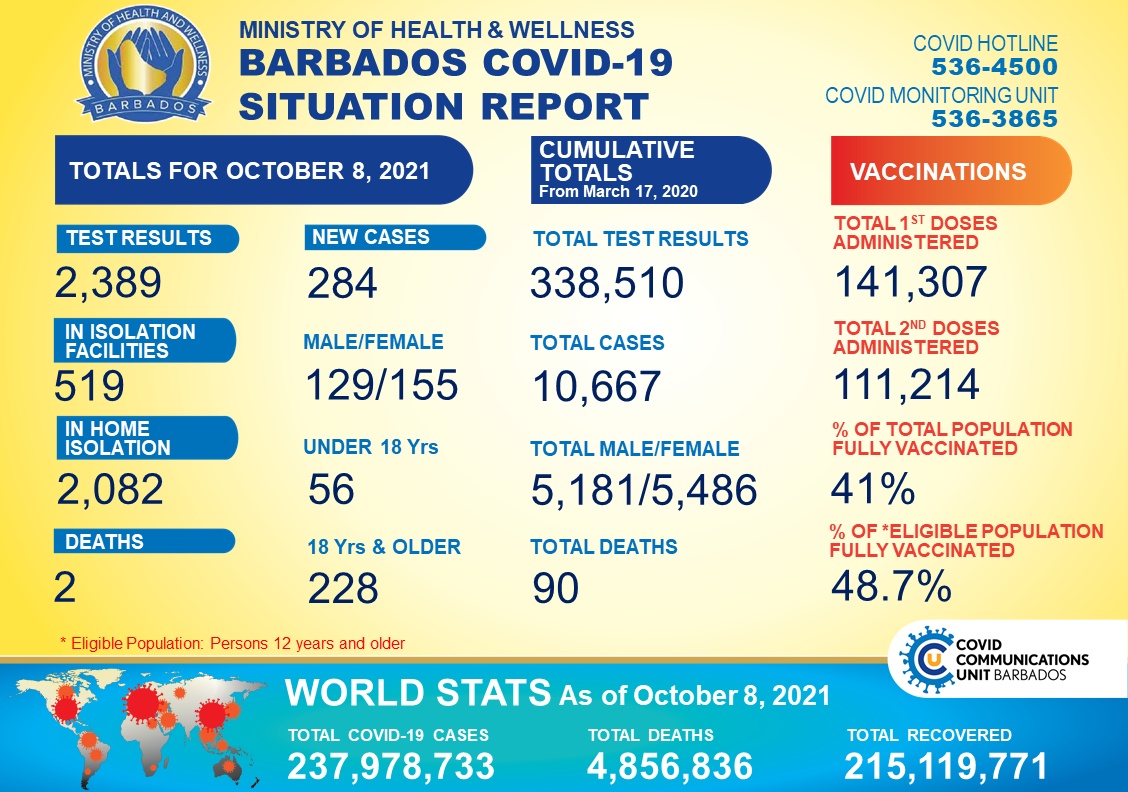
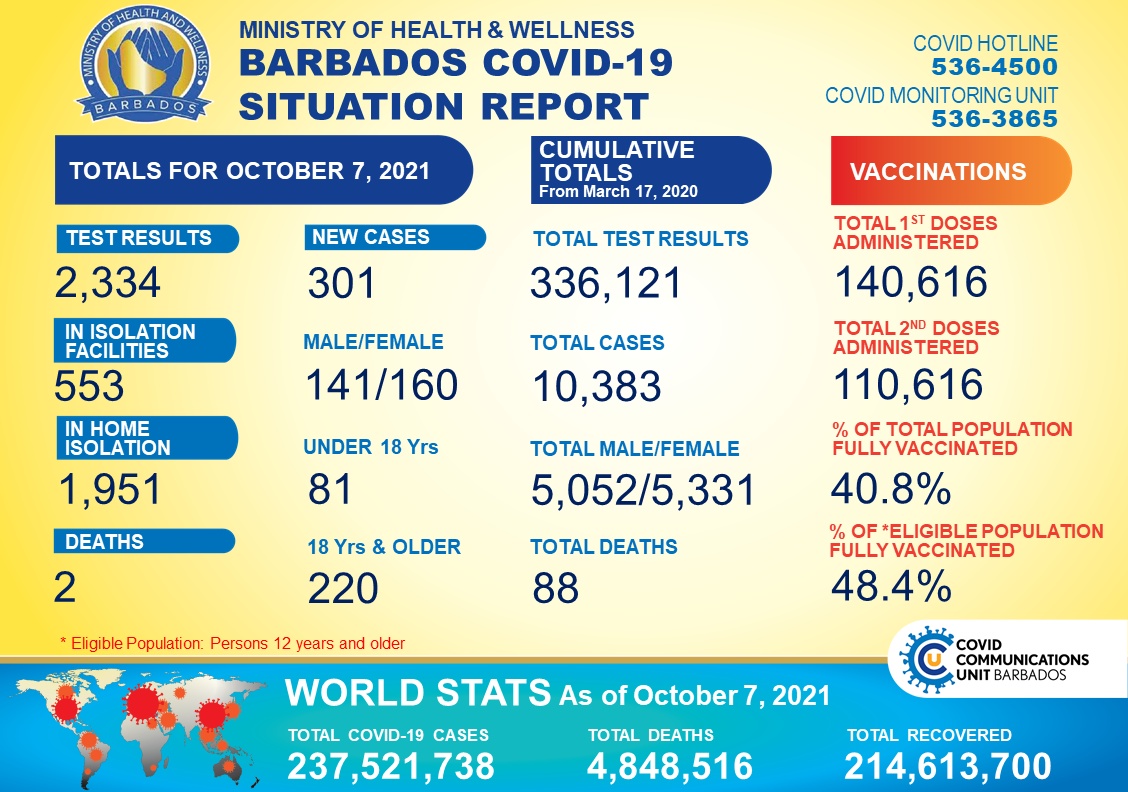
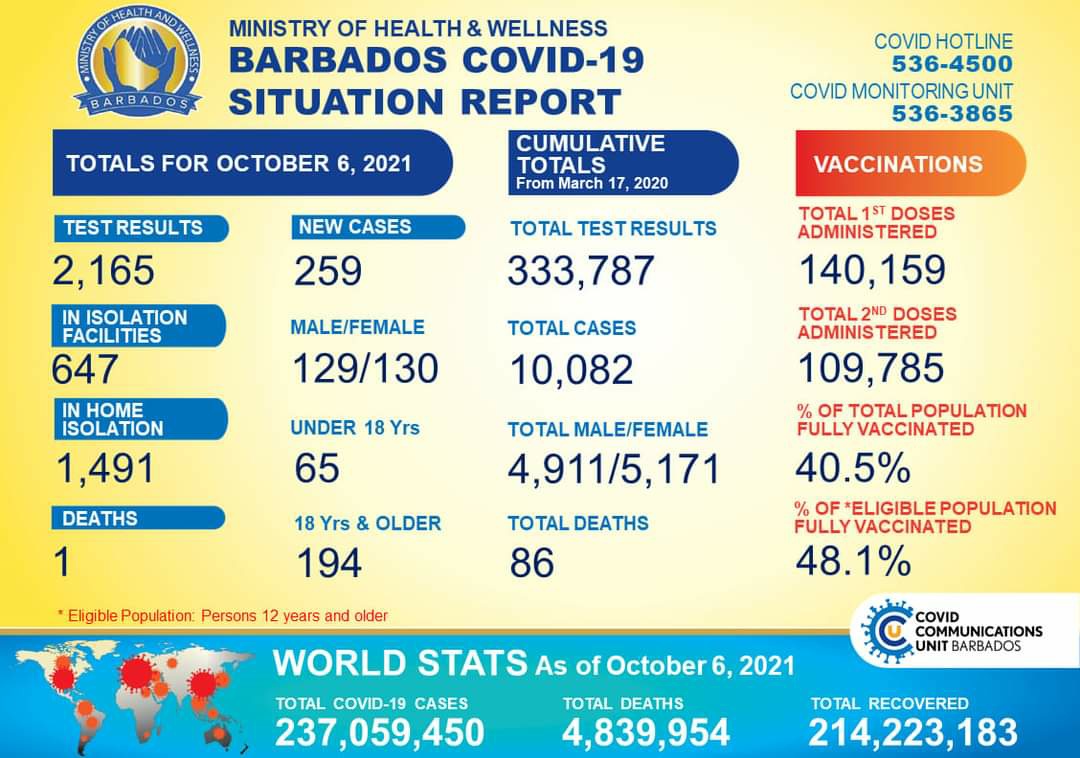
Barbados Covid-19 Status
Current 7-day trends
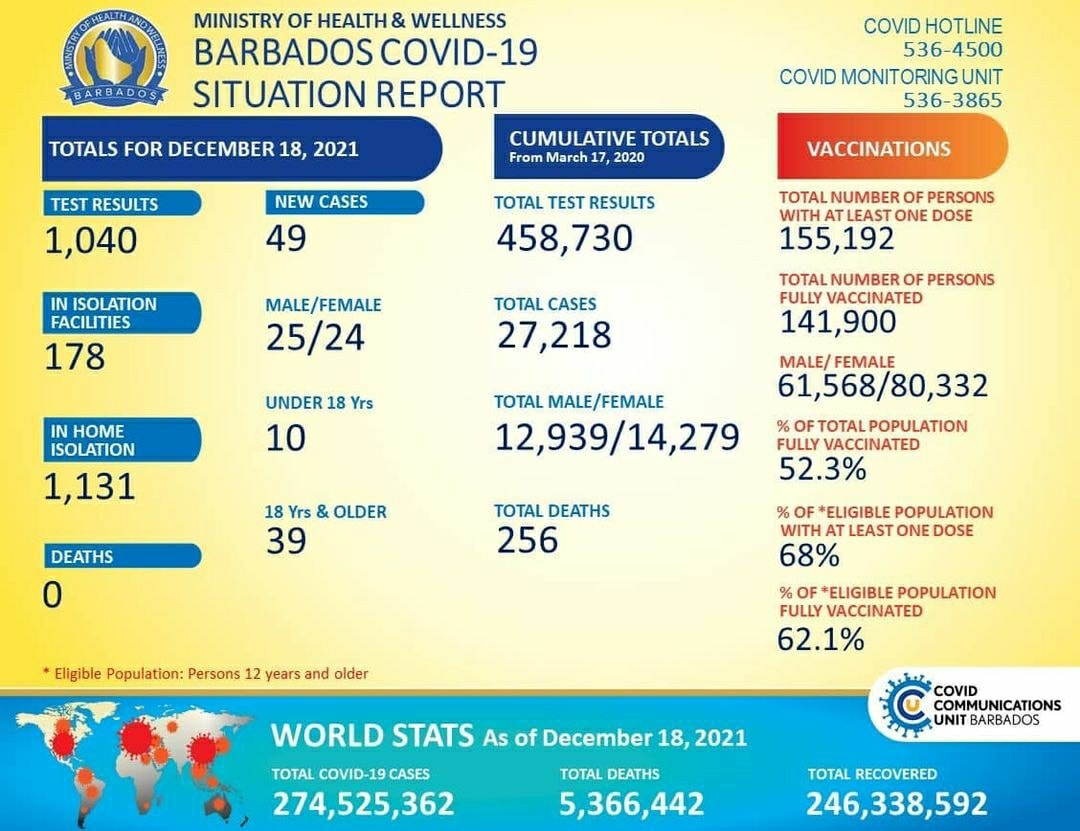
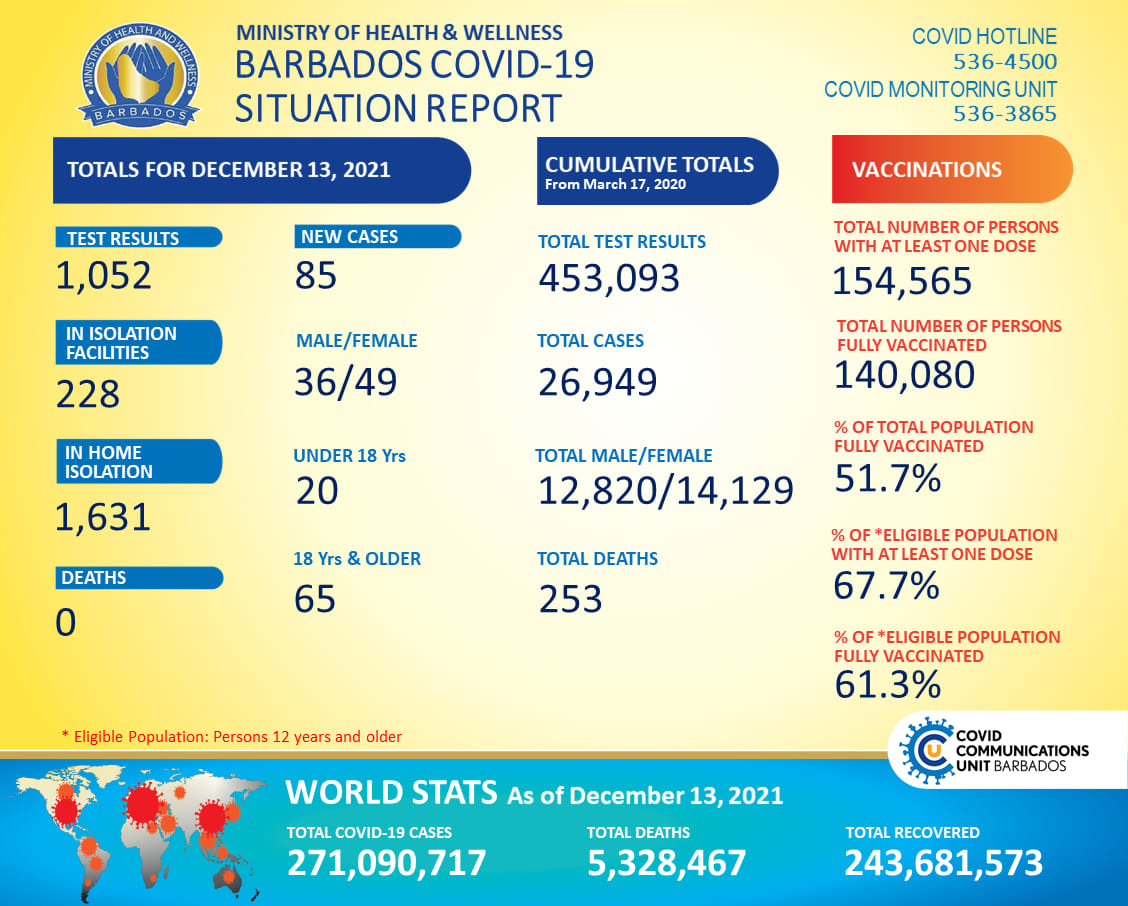
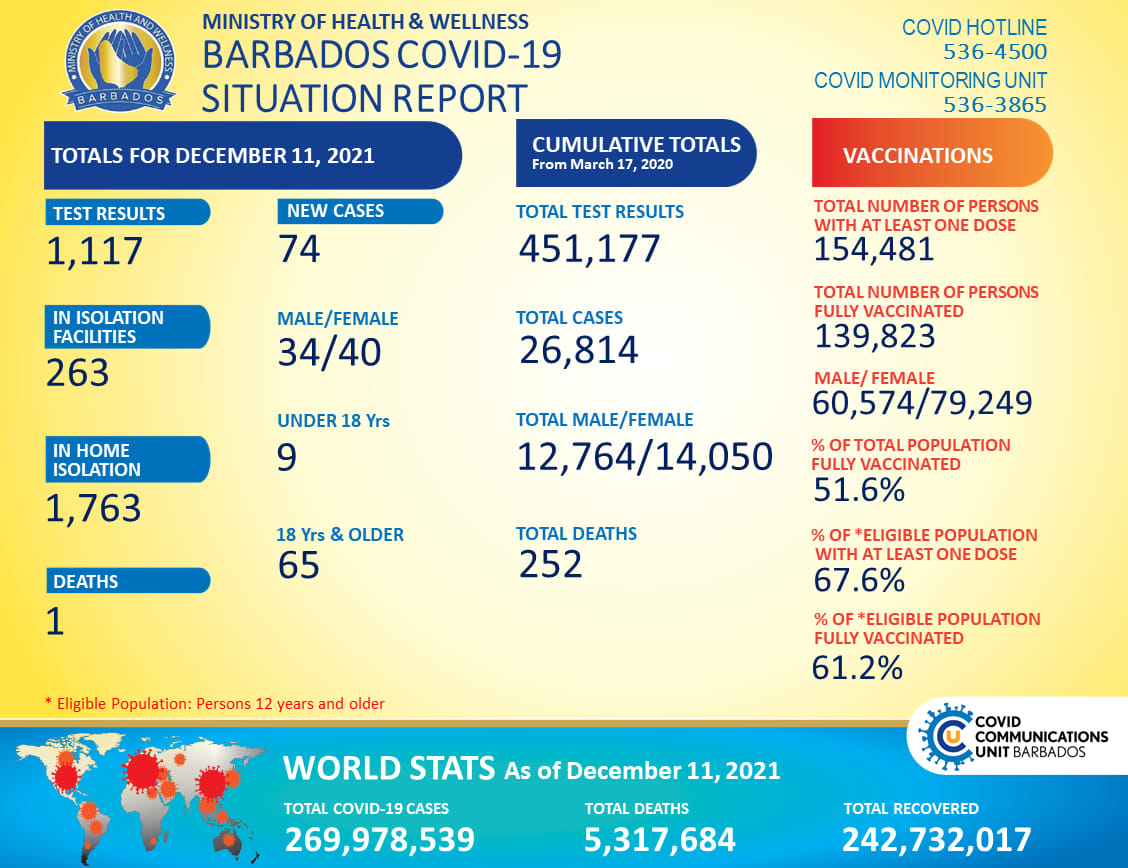
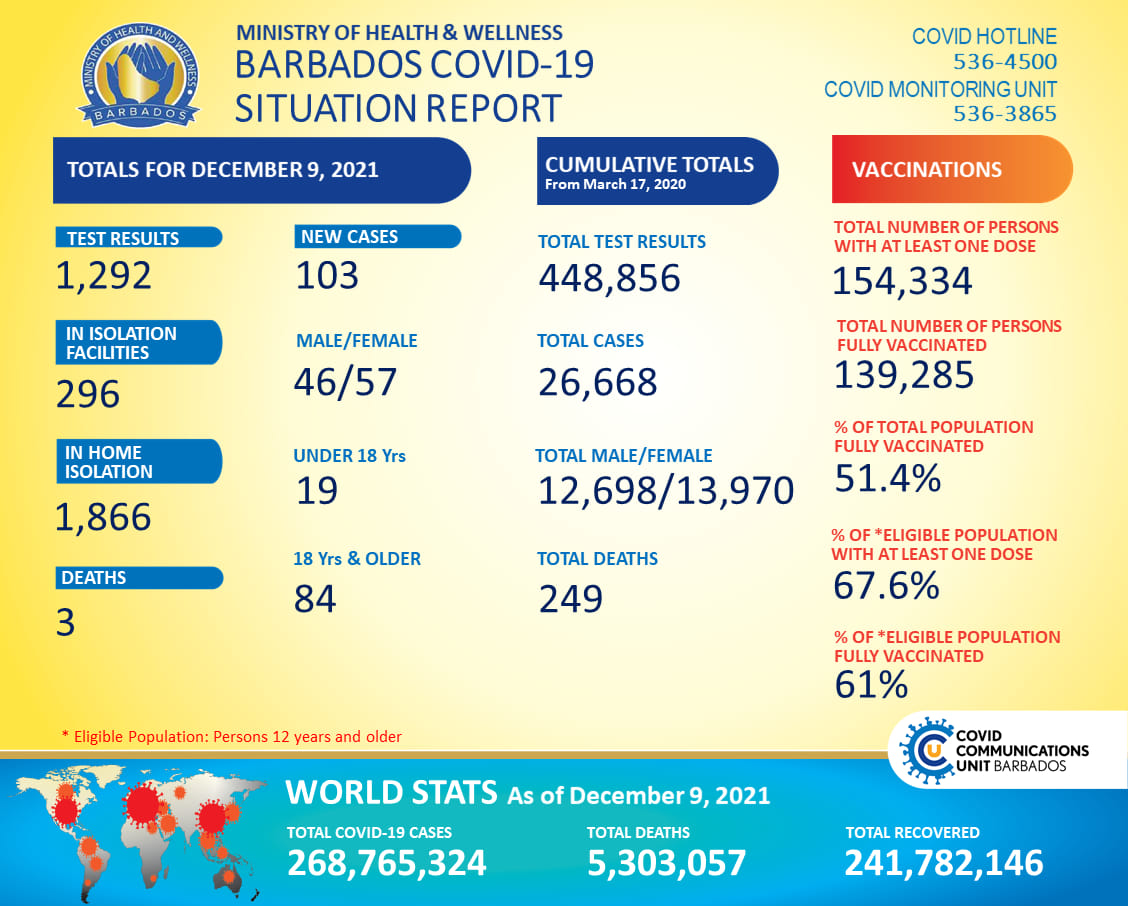
New cases
Ø per day
Positivity rate
Ø
Isolated persons
Tests
Ø per day
Deaths
Ø per day
One dose vaccinated
Ø per day
One dose vaccinated
of total population
(287,375)
Second dose or fully vaccinated
of total population
(287,375)
CCU Dashboards


Sources: Worldometers | MedicalNewsToday
Sources: CSSE - Johns Hopkins University | Worldometers
Sources: CSSE - Johns Hopkins University | Worldometers
Source: CGDL - Our World In Data
Global - Map overview
Source: The Economist
Lastest news
Automatic feed collecting articles with related keywords in content

For all data (since Jan 2021) and calculation details see: Google Spreadsheet Document
Because of daily fluctuations the 7-day average is primarily used for trend visualization.
Information and visualization provided is based on private calculations without any guarantee or claim of accuracy or actuality. Everything on this website released as Public Domain / Creative Commons CC0 and can be used freely by anyone.
Raw data based on daily published informations from the Barbados Government Information Service
https://gisbarbados.gov.bb/
https://www.facebook.com/gisbarbados/
Updates are usually published by the BGIS at the end of next day.
Amazing contributions and support from:
- Kiki F. - Questions leading to correction of the positivity rate calculation
- Antonio M. - Verifying "R number" calculation
- Shanna W. - Clarifying herd immunity description
- Andrew M. - Providing demographic details and data source for international vaccination progress comparison
- Andrew H. - Adjustment of the %-level for the herd immunity calculation
- Julia H. - Idea for graph "Mortality by Age/Gender"
- Dirk H. - Idea for better visualisation "Mortality by Age"
- Joke F. - A lot of help for the trend overview calculations
- Patricia P. - Idea to scroll to the related graph after click on a trend
- Nikita J. - Idea to include the vaccination % into the overview
- Kiki F. - Idea to expand the visible timespan in the graphs to 3 months
- Anna C. - Idea to include the daily total vaccine doses in the graph
- Adam T. - Idea to include the vaccination status in the mortality graphs
- Michael H. - Idea to include the estimated immunity after recoveries into the calculations
- Adam T. - Daily data collection, updating and verifying the mortality graphs
- Matthew E. - Idea for graph "Vaccinations by Gender"
- Romel W. - Idea for peak values by day overview